Table of Contents
ToggleUsing Technical Analysis to Generate Trading Ideas
Introduction
In today’s volatile financial markets, the ability to generate effective trading ideas is critical for investors and traders alike. Whether one is engaged in stock trading, forex trading, or cryptocurrency investments, the need for analytical tools to predict market movements has never been more important. Using technical analysis to generate trading ideas equips traders with the skills to interpret price movements and make informed decisions. This article explores how technical analysis can serve as a powerful ally for both novice and experienced traders, underlying its significance in developing a successful trading strategy.
What is Technical Analysis?
Definition of Technical Analysis
Technical analysis is the study of past market data, primarily price and volume, to forecast future price movements. Traders utilize various tools and methodologies to evaluate these factors and develop a strategy to enter or exit trades. Unlike fundamental analysis, which focuses on a company’s financial health and economic indicators, technical analysis delves solely into price action and patterns.
History and Evolution of Technical Analysis
The roots of technical analysis can be traced back to the early 20th century when Charles Dow laid the foundation of price charting through the construction of the Dow Jones Industrial Average (DJIA). Since then, various theories and techniques have evolved, including Dow Theory and Elliott Wave Theory, paving the way for the incorporation of advanced algorithms and automated trading systems.
The Importance of Technical Analysis in Trading Ideas
Relevance in Different Markets
The importance of technical analysis cannot be overstated. It serves as a universal language for traders in various markets, such as stocks, forex, and cryptocurrencies. By understanding price movements and indicators, traders can identify trends and make informed trading decisions that align with their financial goals.
Market Psychology and Behavior
Technical analysis is deeply intertwined with market psychology. Price movements are often a reflection of trader behavior, where emotions such as fear and greed can drive fluctuations. By using technical analysis, traders can interpret these behavioral patterns, allowing them to anticipate potential market reversals and capitalize on emerging trends.
Key Components of Technical Analysis
Charts and Patterns
Types of Charts
- Line Charts: Basic representation of price movement over time.
- Bar Charts: Displays price range with open, high, low, and close (OHLC).
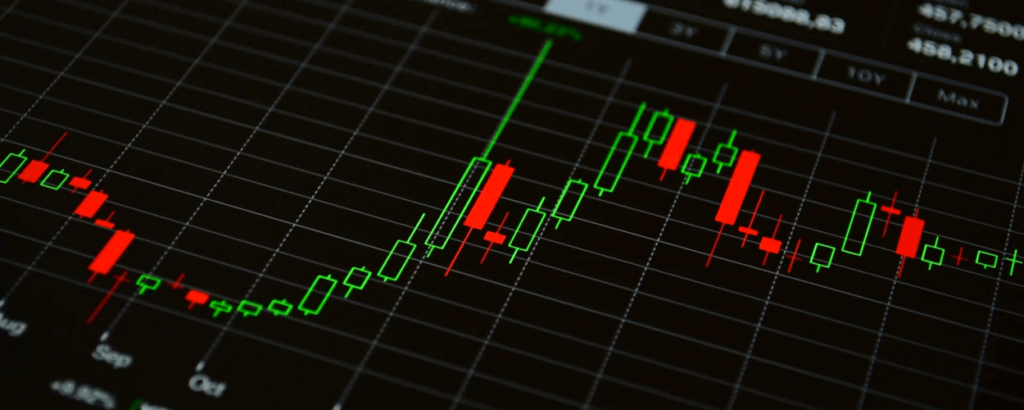
- Candlestick Charts: Offers detailed information, commonly used for identifying patterns and trends.
Recognizing Patterns
Traders often look for specific chart patterns to develop trading ideas. Some of the most popular include:
- Head and Shoulders: A reversal pattern that indicates a potential change in trend.
- Flags and Pennants: Continuation patterns that signal the strength of the prevailing trend.
- Double Tops/Bottoms: Indicates potential reversals when prices fail to break support or resistance levels.
Indicators and Oscillators
Indicators are mathematical calculations based on price and volume data, designed to provide insights into market trends. Some widely used indicators include:
- Moving Averages: Helps to smooth price data by creating a constantly updated average price.
- Relative Strength Index (RSI): Measures the speed and change of price movements, indicating overbought or oversold conditions.
- MACD (Moving Average Convergence Divergence): A trend-following momentum indicator that shows the relationship between two moving averages.
Volume Analysis
Volume is a critical aspect of technical analysis. Analyzing volume trends alongside price movement can confirm or refute price trends, thereby helping traders validate their trading ideas. High volume on price increases indicates strong buying pressure, whereas high volume on price decreases reflects significant selling pressure.
How to Use Technical Analysis to Generate Trading Ideas
Step-by-Step Guide
- Choosing a Trading Platform: Select a reliable trading platform that offers advanced charting tools and technical indicators. A high-quality trading platform is essential for effective analysis. Visit FinanceWorld.io for a comprehensive list of broker reviews and resources.
- Understanding the Basics of Charting: Familiarize yourself with how to read and interpret charts. Determine the most suitable chart type for your trading strategy.
- Identify Key Support and Resistance Levels: Use historical price data to pinpoint areas where the price has continuously bounced upward (support) or downward (resistance). This can provide critical insights into potential price movements.
- Utilizing Indicators for Confirmation: Apply technical indicators like moving averages, RSI, or MACD to further strengthen your trading ideas. Look for confluences among various indicators to validate entry and exit points.
- Recognizing Chart Patterns: Keep an eye out for identifiable chart patterns such as triangles, channels, and flags. These patterns can provide actionable signals for trades.
- Volume Confirmation: Always assess volume to determine the strength of a price movement. Increasing volume during a price rise strengthens the trend, while increasing volume during a price fall suggests weakness.
- Backtesting and Analysis: Before executing trades, backtest your strategies using historical data. This will allow you to understand how your trading ideas would have performed under different market conditions.
- Continuous Learning: Markets are dynamic, and continual adjustments are necessary. Engage in educational resources, trading courses, and webinars to enhance your skills over time.
Example of Generating a Trading Idea
Imagine a trader analyzing the S&P 500 index. They notice a double bottom pattern has formed on a daily chart, along with an increasing RSI that indicates momentum is shifting. The trader confirms the breakout above the recent resistance level with substantial trading volume.
This combination of chart patterns, volume analysis, and momentum indicators provides a solid foundation for the trader to buy into the market.
Best Technical Analysis Tools and Resources
TradingView
TradingView is an excellent platform known for its user-friendly interface, robust charting capabilities, and extensive community sharing trading ideas. It provides traders with customizable indicators and the ability to implement algorithmic trading strategies.
MetaTrader 4/5
Popular among forex traders, MetaTrader platforms offer various analysis tools, real-time market data, and robust charting functionalities. It is ideal for those who want to incorporate automated trading systems into their strategies.
Stock Screening Tools
Stock screening tools enable traders to filter and identify trading opportunities based on predefined criteria. Popular screening sites include Yahoo Finance and Finviz, which allow traders to tailor their searches according to specific metrics and technical indicators.
Challenges and Limitations of Technical Analysis
Misinterpretation of Signals
One of the significant drawbacks of technical analysis lies in the subjective nature of analyzing charts and indicators. Different traders might interpret the same data differently, leading to conflicting trading ideas.
Whipsaw Effect
The whipsaw effect refers to market conditions where prices reverse direction rapidly, causing losses for traders following technical signals. Using stop-loss orders can mitigate risks associated with this phenomenon.
Market Noise
Price movement can be influenced by external factors beyond the predictive power of technical analysis. Economic reports, geopolitical events, and market sentiment can disrupt trends, making it essential to stay informed.
Conclusion
In sum, using technical analysis to generate trading ideas serves as a vital component in a trader’s toolkit. Understanding chart patterns, indicators, and volume analysis allows traders to make informed decisions that can lead to greater financial success. However, it is essential to remember that no single approach guarantees profits, and a diverse strategy may be necessary to navigate the complexities of the market.
For those looking to take their trading endeavors to the next level, consider exploring tools such as trading signals and stock screeners offered at FinanceWorld.io. Embrace the art and science of technical analysis, develop your trading ideas, and let them guide your financial journey.
Did you find this article helpful? Please rate your experience!