Learn

Exploring Cryptocurrency Price Charts for Beginners

Exploring Cryptocurrency Price Charts for Beginners

Introduction

In the rapidly evolving realm of finance, exploring cryptocurrency price charts has emerged as a fundamental skill for both novice and seasoned investors alike. As digital currencies gain momentum as viable investment options, understanding price trends, chart patterns, and market sentiments becomes essential. This guide serves as a comprehensive resource for beginners eager to navigate the complexities of cryptocurrency price charts, enabling them to make informed decisions in the volatile cryptocurrency market.

The Importance of Cryptocurrency Price Charts

Cryptocurrency markets are unique; they operate 24/7 and are known for their high volatility. Utilizing cryptocurrency price charts allows investors to visualize market trends, assess performance over time, and establish connections between various cryptocurrencies and broader financial metrics. This capacity to analyze price movement can lead to improved investment strategies and better outcomes for traders.

Understanding Cryptocurrency Price Charts

What is a Cryptocurrency Price Chart?

A cryptocurrency price chart is a graphical representation of a digital asset’s price over a specific period. Price charts can display various information, including opening, closing, high, and low prices during the selected time frame. This data helps investors identify trends, making it a powerful tool for decision-making.

Types of Cryptocurrency Price Charts

1. Line Charts

Line charts are one of the simplest forms of cryptocurrency price charts. They plot the closing price of a cryptocurrency over time, connecting data points with a continuous line. This type of chart is useful for visualizing price trends over a long period.

2. Bar Charts

Bar charts provide more detailed information than line charts, displaying the opening, closing, high, and low prices for a specific time frame. Each bar represents a time period, allowing traders to analyze price data more comprehensively.

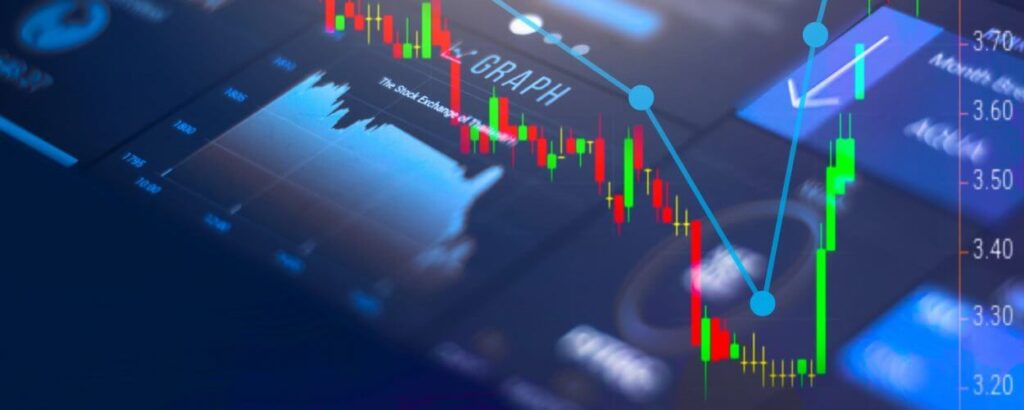
3. Candlestick Charts

Candlestick charts are favored by experienced traders for their rich data presentation. Each “candlestick” shows the opening, closing, high, and low prices for a selected period, offering insights into the volatility and market sentiment.

How to Read Cryptocurrency Price Charts

Understanding how to read cryptocurrency price charts is vital. Here’s a breakdown of key components:

1. Time Frame

Selecting an appropriate time frame is crucial in analyzing price movements. Common time frames include:

  • 1 Minute: Ideal for day trading.
  • 1 Hour: Good for short-term trading strategies.
  • 1 Day: Useful for analyzing overall trends and market behaviors.

2. Price Axis

The vertical axis represents the price of the cryptocurrency. Understanding this axis enables you to determine how much a cryptocurrency has fluctuated over the specified period.

3. Volume Indicator

Often located at the bottom of the chart, the volume indicator shows how much of a cryptocurrency was traded during a specific period. High volume can indicate a strong interest or significant market momentum.

Practical Techniques for Analyzing Cryptocurrency Price Charts

Identifying Trends in Cryptocurrency Price Charts

1. Bullish and Bearish Trends

  • Bullish Trend: Characterized by rising prices, which typically leads to buying opportunities.
  • Bearish Trend: Defined by falling prices, which often signifies selling opportunities.

Chart Patterns to Watch

Recognizing chart patterns is essential for predicting future price movements. Key patterns include:

  • Head and Shoulders: Indicates potential reversals.
  • Double Tops and Bottoms: Suggests trend reversals.
  • Triangles: Signifies a consolidation period before breakout.

Using Technical Indicators

Incorporate technical indicators to enhance your analysis. Popular indicators include:

  • Moving Averages: Smooth price data to identify trends over a specified time.
  • Relative Strength Index (RSI): Assesses the speed and change of price movements, helping to identify overbought or oversold conditions.
  • Bollinger Bands: These bands provide a visual representation of volatility, indicating potential buy or sell signals when the price approaches the bands.

Cryptocurrency Trading Strategies

Day Trading Strategy

Day trading involves buying and selling cryptocurrencies within the same day. Utilize short-term charts (1 minute, 5 minute) combined with technical indicators to capitalize on price movements.

Swing Trading

Swing trading targets short to medium-term price gains. Traders typically hold positions from several days to weeks, analyzing daily and hourly charts to identify entry and exit points.

Long-Term Investing

For those who prefer a more hands-off approach, long-term investing in cryptocurrencies involves buying and holding assets for months or years. Use daily or weekly charts to evaluate performance over time.

Developing a Winning Trading Plan

Setting Objectives

Define clear investment goals based on risk tolerance and time horizon. Are you looking for short-term gains, or are you willing to commit to long-term investments?

Risk Management Strategies

Implement risk management strategies to shield your investment from sudden market downturns. Consider the following:

  • Stop-Loss Orders: Automatically sell a cryptocurrency when it reaches a certain price to minimize losses.
  • Diversification: Spread investments across various cryptocurrencies to mitigate risk.

Tools and Resources for Price Chart Analysis

Online Charting Platforms

Leverage online platforms that provide advanced charting tools. Notable options include:

  • TradingView: Offers a variety of charting tools and technical indicators.
  • CoinMarketCap: A reliable source for real-time cryptocurrency data and price charts.

News and Analysis Websites

Stay updated with the latest market news to make informed decisions. Websites like FinanceWorld.io provide insights into market trends, cryptocurrency investments, and trading strategies.

Community Forums

Engage with online communities, such as Reddit and specialized forums, to share experiences, strategies, and insights related to cryptocurrency trading.

Conclusion

In summary, exploring cryptocurrency price charts is an integral aspect of modern trading and investment strategies. By developing a firm understanding of price indicators, trends, and market analysis, you can significantly enhance your ability to make informed trading decisions. Whether you’re a beginner or an experienced investor, the principles outlined in this guide will serve as a foundation for your investment journey.

Next Steps for Readers

Now that you have a comprehensive understanding of how to navigate cryptocurrency price charts, it’s time to implement your knowledge. Explore various charting platforms, develop your own , and engage with community discussions. For continued learning, check out FinanceWorld.io for further resources, including Trading Signals and Copy Trading.

Did you find this article helpful? We would love to hear your thoughts and experiences related to cryptocurrency trading. Share your insights in the comments below!

Subscribe
Notify of
0 Comments
Oldest
Newest Most Voted
Inline Feedbacks
View all comments

Welcome to the World of Trading

Find out why millions of traders and investors use the services of FinaceWorld.io

Trading Signals

Subscribe to trading signals and get instant notifications when enter or exit the market.

Hedge Fund

Automate your trading with our superb Copy Trading Solution.

Related articles

**Excerpt:** Multi-family offices optimize diversified investment approaches. **Meta Description:** Discover how multi-family offices are enhancing investment strategies through diversification, expert insights, and tailored solutions for affluent families, looking ahead to
### Excerpt "Private family offices can significantly enhance wealth management." ### Meta Description Discover how private family offices streamline wealth management, elevate investment strategies, and promote family legacy preservation from

Might be interesting

**Excerpt:** Broadcom stock shows potential for substantial growth. **Meta Description:** Explore Broadcom's stock predictions for 2025-2030, analyzing key growth drivers, market trends, and factors influencing its future performance.
Login To Pro Account to Get Notified With Closed Deals Too.
Symbol Type Open Time Close Time Open Price Close Price Profit
USDCADBUY2025.04.04 07:36:22Only PRO1.411.410.01%
USDCADBUY2025.04.04 07:36:22Only PRO1.411.430.86%
JNJBUY2025.04.03 16:31:13Only PRO159.76159.59-0.11%
JNJBUY2025.04.03 16:31:13Only PRO159.76148.44-7.09%
LLYBUY2025.04.03 13:40:05Only PRO816.46814.16-0.28%
LLYBUY2025.04.03 13:40:05Only PRO816.46683.21-16.32%
FR40BUY2025.04.01 00:00:11Only PRO7,801.207,798.91-0.03%
FR40BUY2025.04.01 00:00:11Only PRO7,801.206,912.90-11.39%
ABBVBUY2025.03.28 13:40:18Only PRO202.69202.41-0.14%
ABBVBUY2025.03.28 13:40:18Only PRO202.69175.21-13.56%
PGBUY2025.03.21 13:40:10Only PRO168.00167.74-0.15%
PGBUY2025.03.21 13:40:10Only PRO168.00159.50-5.06%
XAUUSDSELL2025.03.19 01:06:20Only PRO3,029.5423,030.885-0.04%
XAUUSDSELL2025.03.19 01:06:20Only PRO3,029.5423,018.7810.36%
ADBEBUY2025.03.18 16:16:46Only PRO389.83389.55-0.07%
ADBEBUY2025.03.18 16:16:46Only PRO389.83334.01-14.32%
ABTBUY2025.03.18 13:40:11Only PRO128.44128.02-0.33%
ABTBUY2025.03.18 13:40:11Only PRO128.44120.13-6.47%
CSCOBUY2025.03.17 15:33:25Only PRO60.2460.13-0.18%
CSCOBUY2025.03.17 15:33:25Only PRO60.2452.41-13.00%
COSTBUY2025.03.17 13:40:26Only PRO904.80907.430.29%
COSTBUY2025.03.17 13:40:26Only PRO904.80965.556.71%
VBUY2025.03.14 16:00:01Only PRO332.17332.07-0.03%
VBUY2025.03.14 16:00:01Only PRO332.17301.26-9.31%
LLYBUY2025.03.14 16:00:00Only PRO810.93810.22-0.09%
LLYBUY2025.03.14 16:00:00Only PRO810.93835.793.07%
MABUY2025.03.14 13:41:14Only PRO523.31522.99-0.06%
MABUY2025.03.14 13:41:14Only PRO523.31469.23-10.33%
UK100BUY2025.03.12 08:02:39Only PRO8,518.158,513.71-0.05%
UK100BUY2025.03.12 08:02:39Only PRO8,518.157,672.29-9.93%
NFLXBUY2025.03.11 13:40:00Only PRO880.43878.56-0.21%
NFLXBUY2025.03.11 13:40:00Only PRO880.43960.989.15%
AAPLBUY2025.03.06 14:41:46Only PRO235.24235.260.01%
AAPLBUY2025.03.06 14:41:46Only PRO235.24177.53-24.53%
EURUSDSELL2025.03.06 12:00:01Only PRO1.079891.079910.00%
EURUSDSELL2025.03.06 12:00:01Only PRO1.079891.09654-1.54%
GBPUSDSELL2025.03.06 09:00:17Only PRO1.288651.28888-0.02%
GBPUSDSELL2025.03.06 09:00:17Only PRO1.288651.29077-0.16%
EURJPYSELL2025.03.06 08:00:05Only PRO160.263160.1830.05%
EURJPYSELL2025.03.06 08:00:05Only PRO160.263159.7490.32%
WMTBUY2025.03.05 20:24:22Only PRO96.1496.05-0.09%
WMTBUY2025.03.05 20:24:22Only PRO96.1480.58-16.18%
HDBUY2025.03.05 20:00:01Only PRO384.66384.46-0.05%
HDBUY2025.03.05 20:00:01Only PRO384.66334.05-13.16%
ORCLBUY2025.03.05 16:00:01Only PRO158.64158.18-0.29%
ORCLBUY2025.03.05 16:00:01Only PRO158.64119.84-24.46%
NVDABUY2025.03.04 18:12:16Only PRO117.38117.19-0.16%
NVDABUY2025.03.04 18:12:16Only PRO117.3887.84-25.17%
TSMBUY2025.03.03 16:00:20Only PRO178.20177.82-0.21%
TSMBUY2025.03.03 16:00:20Only PRO178.20181.381.78%
AUDUSDBUY2025.03.02 22:05:07Only PRO0.622140.62062-0.24%
AUDUSDBUY2025.03.02 22:05:07Only PRO0.622140.635082.08%
METABUY2025.02.28 15:58:14Only PRO663.42663.680.04%
METABUY2025.02.28 15:58:14Only PRO663.42482.52-27.27%
USDCADSELL2025.02.28 15:02:28Only PRO1.441.44-0.04%
USDCADSELL2025.02.28 15:02:28Only PRO1.441.412.70%
USDCADSELL2025.02.28 12:00:00Only PRO1.441.44-0.01%
USDCADSELL2025.02.28 12:00:00Only PRO1.441.44-0.09%
AVGOBUY2025.02.26 16:00:00Only PRO210.83205.65-2.46%
AVGOBUY2025.02.26 16:00:00Only PRO210.83139.91-33.64%
JPMBUY2025.02.26 15:53:19Only PRO261.02260.48-0.21%
JPMBUY2025.02.26 15:53:19Only PRO261.02203.83-21.91%
BACBUY2025.02.26 14:40:00Only PRO44.0244.110.20%
BACBUY2025.02.26 14:40:00Only PRO44.0233.87-23.06%
BTCUSDBUY2025.02.26 04:00:00Only PRO88,857.1384,035.66-5.43%
BTCUSDBUY2025.02.26 04:00:00Only PRO88,857.1376,359.38-14.06%
US500BUY2025.02.25 20:00:10Only PRO5,972.435,928.73-0.73%
US500BUY2025.02.25 20:00:10Only PRO5,972.434,864.44-18.55%
WMTBUY2025.02.25 14:51:45Only PRO95.2095.16-0.04%
WMTBUY2025.02.25 14:51:45Only PRO95.2097.982.92%
HDBUY2025.02.25 14:40:09Only PRO392.02390.64-0.35%
HDBUY2025.02.25 14:40:09Only PRO392.02394.160.55%
USDJPYBUY2025.02.24 04:00:00Only PRO149.17149.14-0.02%
USDJPYBUY2025.02.24 04:00:00Only PRO149.17146.74-1.63%
AMZNBUY2025.02.19 19:37:22Only PRO225.70225.67-0.01%
AMZNBUY2025.02.19 19:37:22Only PRO225.70164.44-27.14%
GOOGLBUY2025.02.10 20:00:01Only PRO186.62186.42-0.11%
GOOGLBUY2025.02.10 20:00:01Only PRO186.62141.11-24.39%
MRKBUY2025.02.07 16:00:00Only PRO88.1888.02-0.18%
MRKBUY2025.02.07 16:00:00Only PRO88.1891.363.61%
TSLABUY2025.02.07 14:40:28Only PRO374.89375.220.09%
TSLABUY2025.02.07 14:40:28Only PRO374.89217.76-41.91%
USDJPYBUY2025.02.07 04:00:00Only PRO151.59151.54-0.03%
USDJPYBUY2025.02.07 04:00:00Only PRO151.59154.421.87%
XAUUSDSELL2025.02.05 20:02:02Only PRO2,862.2692,862.919-0.02%
XAUUSDSELL2025.02.05 20:02:02Only PRO2,862.2692,882.034-0.69%
MSFTBUY2025.02.03 20:00:00Only PRO413.56413.25-0.07%
MSFTBUY2025.02.03 20:00:00Only PRO413.56346.45-16.23%
BTCUSDBUY2025.02.03 15:24:27Only PRO97,981.8897,939.03-0.04%
BTCUSDBUY2025.02.03 15:24:27Only PRO97,980.0598,047.030.07%
AVGOBUY2025.01.29 20:00:01Only PRO206.29205.82-0.23%
AVGOBUY2025.01.29 20:00:01Only PRO206.29227.2110.14%
NVDABUY2025.01.28 20:00:00Only PRO127.52126.90-0.49%
NVDABUY2025.01.28 20:00:00Only PRO127.52132.914.23%
XAUUSDSELL2025.01.22 23:40:27Only PRO2,754.0832,754.418-0.01%
XAUUSDSELL2025.01.22 23:40:27Only PRO2,754.0832,739.6590.52%
MCDBUY2025.01.16 20:13:17Only PRO279.31279.25-0.02%
MCDBUY2025.01.16 20:13:17Only PRO279.31283.121.36%
NVDABUY2025.01.15 14:40:00Only PRO132.67132.770.08%
NVDABUY2025.01.15 14:40:00Only PRO132.67136.432.83%
VBUY2025.01.14 14:42:23Only PRO308.83308.64-0.06%
VBUY2025.01.14 14:42:23Only PRO308.83317.782.90%
BABABUY2025.01.13 20:19:42Only PRO80.8080.67-0.16%
BABABUY2025.01.13 20:19:42Only PRO80.8084.845.00%
AAPLBUY2025.01.08 15:13:10Only PRO241.77241.18-0.24%
AAPLBUY2025.01.08 15:13:10Only PRO241.77242.860.45%
MABUY2025.01.08 14:40:11Only PRO515.38515.03-0.07%
MABUY2025.01.08 14:40:11Only PRO515.38525.311.93%
ADBEBUY2025.01.06 16:38:17Only PRO434.37434.04-0.08%
ADBEBUY2025.01.06 16:38:17Only PRO434.37451.343.91%
TSLABUY2025.01.03 16:00:00Only PRO387.36386.87-0.13%
TSLABUY2025.01.03 16:00:00Only PRO387.36427.9010.47%
MSFTBUY2025.01.03 14:40:00Only PRO422.72421.96-0.18%
MSFTBUY2025.01.03 14:40:00Only PRO422.72428.321.32%
GBPUSDBUY2025.01.03 14:02:19Only PRO1.239881.23971-0.01%
GBPUSDBUY2025.01.03 14:02:19Only PRO1.239881.241280.11%
EURUSDBUY2025.01.03 08:00:07Only PRO1.028221.028290.01%
EURUSDBUY2025.01.03 08:00:07Only PRO1.028221.031320.30%
COSTBUY2025.01.02 14:40:13Only PRO919.46919.04-0.05%
COSTBUY2025.01.02 14:40:13Only PRO919.46928.771.01%
0